Analytics
What the Analytics page measures, how each card and chart is calculated, and how session cost is derived.
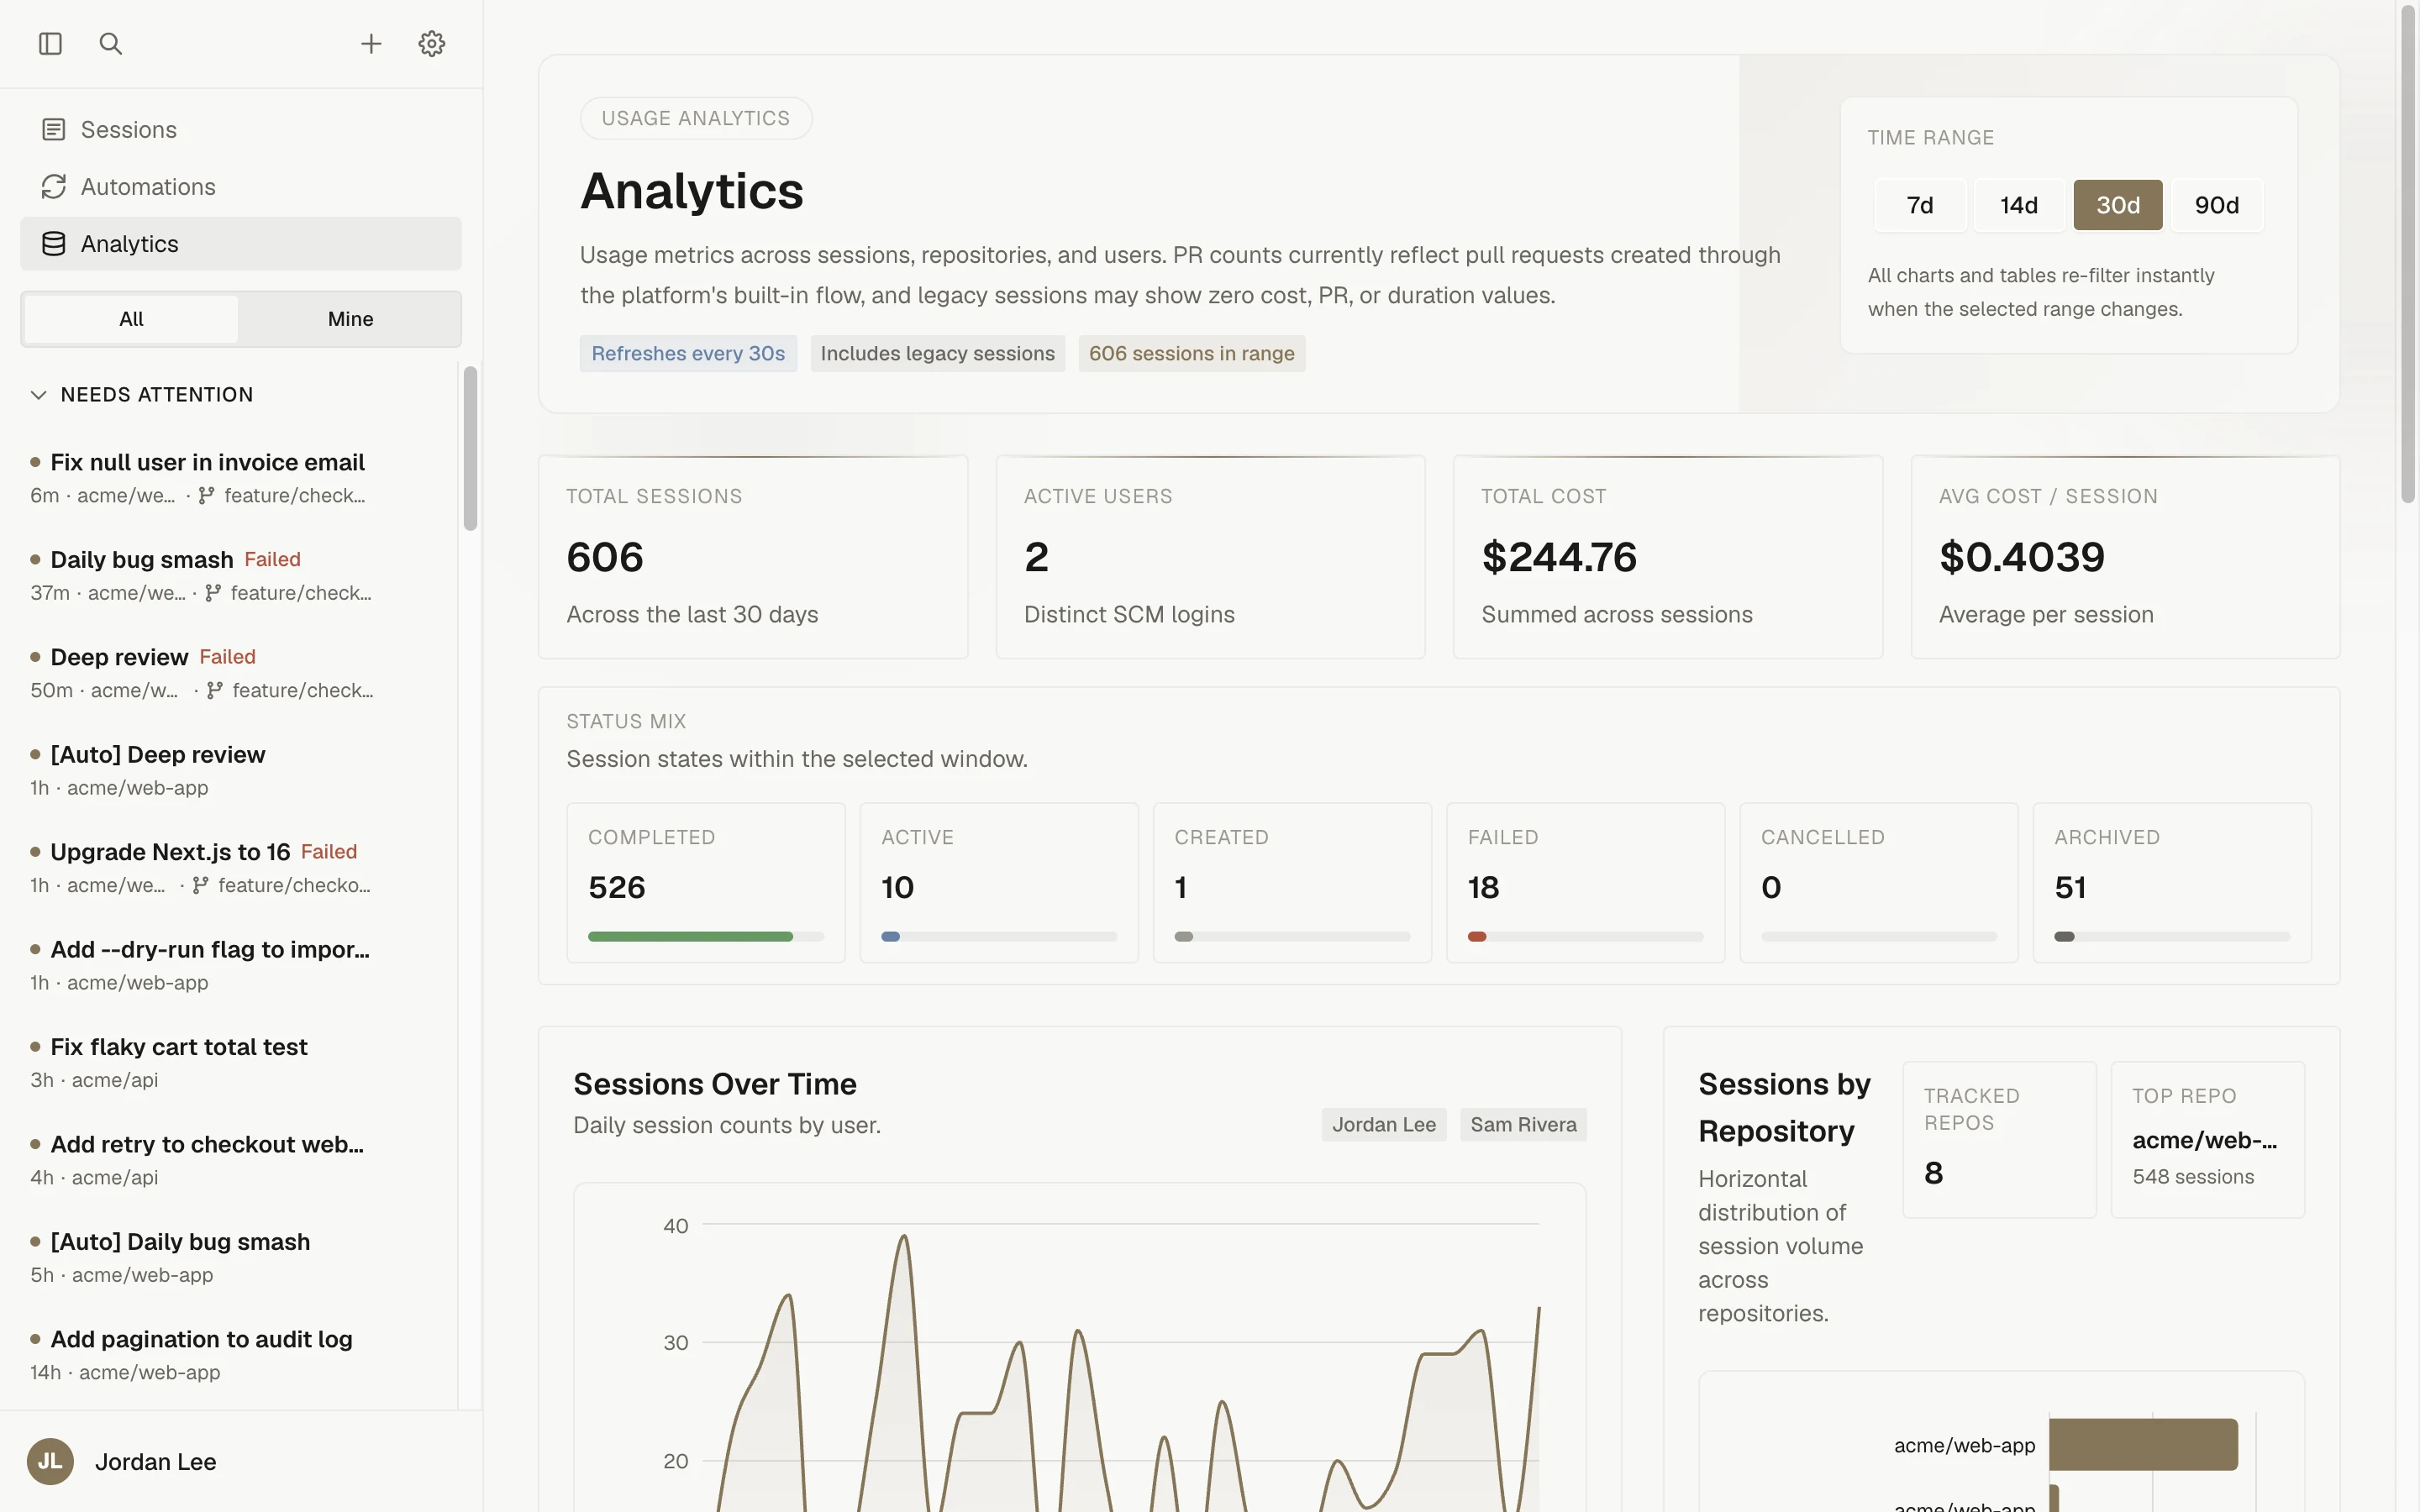
The Analytics page in the sidebar shows usage across sessions, repositories, and users for a chosen window, plus outcomes for the pull requests those sessions opened.
Who can view it
Every role can open Analytics; it requires only analytics.read, which Viewers have. The page refreshes itself every 30 seconds.
Time range
The Time range control offers 7d, 14d, 30d, and 90d. The default is 30 days. Changing the range re-filters every card, chart, and table on the page.
The window is the last N days ending now. Session metrics count sessions created in the window; open-PR inventory is measured as of now regardless of the window.
Which sessions are counted
Session metrics include sessions started by a person, whether from the web app, Slack, Linear, or the GitHub bot. Sessions produced by automations are excluded from the session cards, charts, and user table. The Pull Requests section is different: it counts every pull request created through OpenInspect, including ones from automation runs, and shows where they came from under By Source.
The header carries an Includes legacy sessions badge. Older sessions recorded before cost, pull request, and duration values were tracked are still counted, and the page notes that they may show zero for those values. PR counts reflect pull requests created through OpenInspect's own pull-request flow.
Summary cards
| Card | Value |
|---|---|
| Total Sessions | Sessions created in the window ("Across the last N days"). |
| Active Users | "Distinct SCM logins": the number of distinct users with a session in the window, keyed by user ID and falling back to the source-control login for sessions without a linked user. |
| Total Cost | "Summed across sessions": the sum of every counted session's recorded cost. |
| Avg Cost / Session | "Average per session": Total Cost divided by Total Sessions. |
Below the cards, Status Mix shows how many sessions in the window are in each status: completed, active, created, failed, cancelled, and archived. See Lifecycle and statuses.
Sessions Over Time
An area chart of daily session counts by user. The five users with the most sessions are listed as badges above the chart, with a "+N more" badge for the rest. Sessions without a linked user appear as "Unknown user". Hover a day to see each user's count.
Sessions by Repository
A horizontal bar chart of session volume per repository, with Tracked repos and Top repo tiles. Hovering a bar shows that repository's sessions, cost, PRs, and messages. Sessions with no repository are grouped under "No repository".
Per-User Breakdown
A sortable table. Click any column heading to sort; click again to reverse.
| Column | Meaning |
|---|---|
| User | Display name or login. Rows labeled "Sessions without linked user" collect sessions with no user record. |
| Sessions | Session count, with badges for completed, failed, and cancelled sessions. |
| Completion Rate | Completed divided by completed + failed + cancelled. Sessions still running are not in the denominator. |
| PRs | Pull requests created by the user's sessions. |
| Messages | Prompts sent across the user's sessions. |
| Total Cost | Sum of recorded cost across the user's sessions. |
| Avg Duration | Average active duration per session; shown as a dash when there is none. |
| Last Active | Relative time of the user's most recent session activity. |
Pull Requests
Rates in this section are computed over pull requests, not sessions. Sessions that never open a pull request (questions, research, debugging) are out of scope here by design.
| Card | Value |
|---|---|
| PRs Created | Pull requests opened in the window. |
| Acceptance Rate | Merged divided by resolved, where resolved is merged plus closed without merging. Still-open PRs are not in the denominator. Shown as a dash until something has resolved. The hint reads "N merged · M closed unmerged". |
| Avg Time to Merge | Mean time from open to merge for pull requests merged in the window; the hint counts "N merged in range". A dash when nothing merged. |
| Open PRs | Pull requests open right now, not limited to the window, with the average age, or "Nothing waiting on review". |
| Cost / Merged PR | The total cost of sessions that produced a pull request in the window, divided by the number merged. A dash until something has merged. |
By Source tiles show, for each origin of the sessions behind these pull requests (user, automation, Slack, and so on), how many were created and how many merged.
Pull Requests Over Time plots daily created versus merged counts. Created is bucketed by the day the PR was opened; merged by the day it merged.
PRs by Repository lists, for pull requests opened in the window: Repository, Created, Merged, Closed, Acceptance (the same merged ÷ resolved definition per repository), and Avg Time to Merge.
How cost is derived
Cost figures are sums of each session's recorded cost. A session's cost is a running total that the agent harness reports to the control plane as each turn finishes:
- OpenCode reports the priced cost of each step, and the session total accumulates those values.
- Claude Agent reports a cumulative cost per turn, and the session records the increase over the previous turn. When the harness reports no cost for a turn, the turn is recorded as $0 and the session timeline shows a warning saying so. The next turn's cost cannot then be separated from the missing one, so it is also recorded as $0 before accounting resumes.
Nothing on this page estimates cost independently of what the harness reported. Values under $1 are shown with extra precision. Per-session cost caps are covered in Spend limits.
Troubleshooting
Next steps
Audit log
What the workspace audit log records, how to read an event, and how to use it to answer who changed what and why a request was denied.
Data controls: archive and restore
How archiving a session works, how to restore archived sessions from Settings › Data Controls, and what deletion and export capabilities exist.